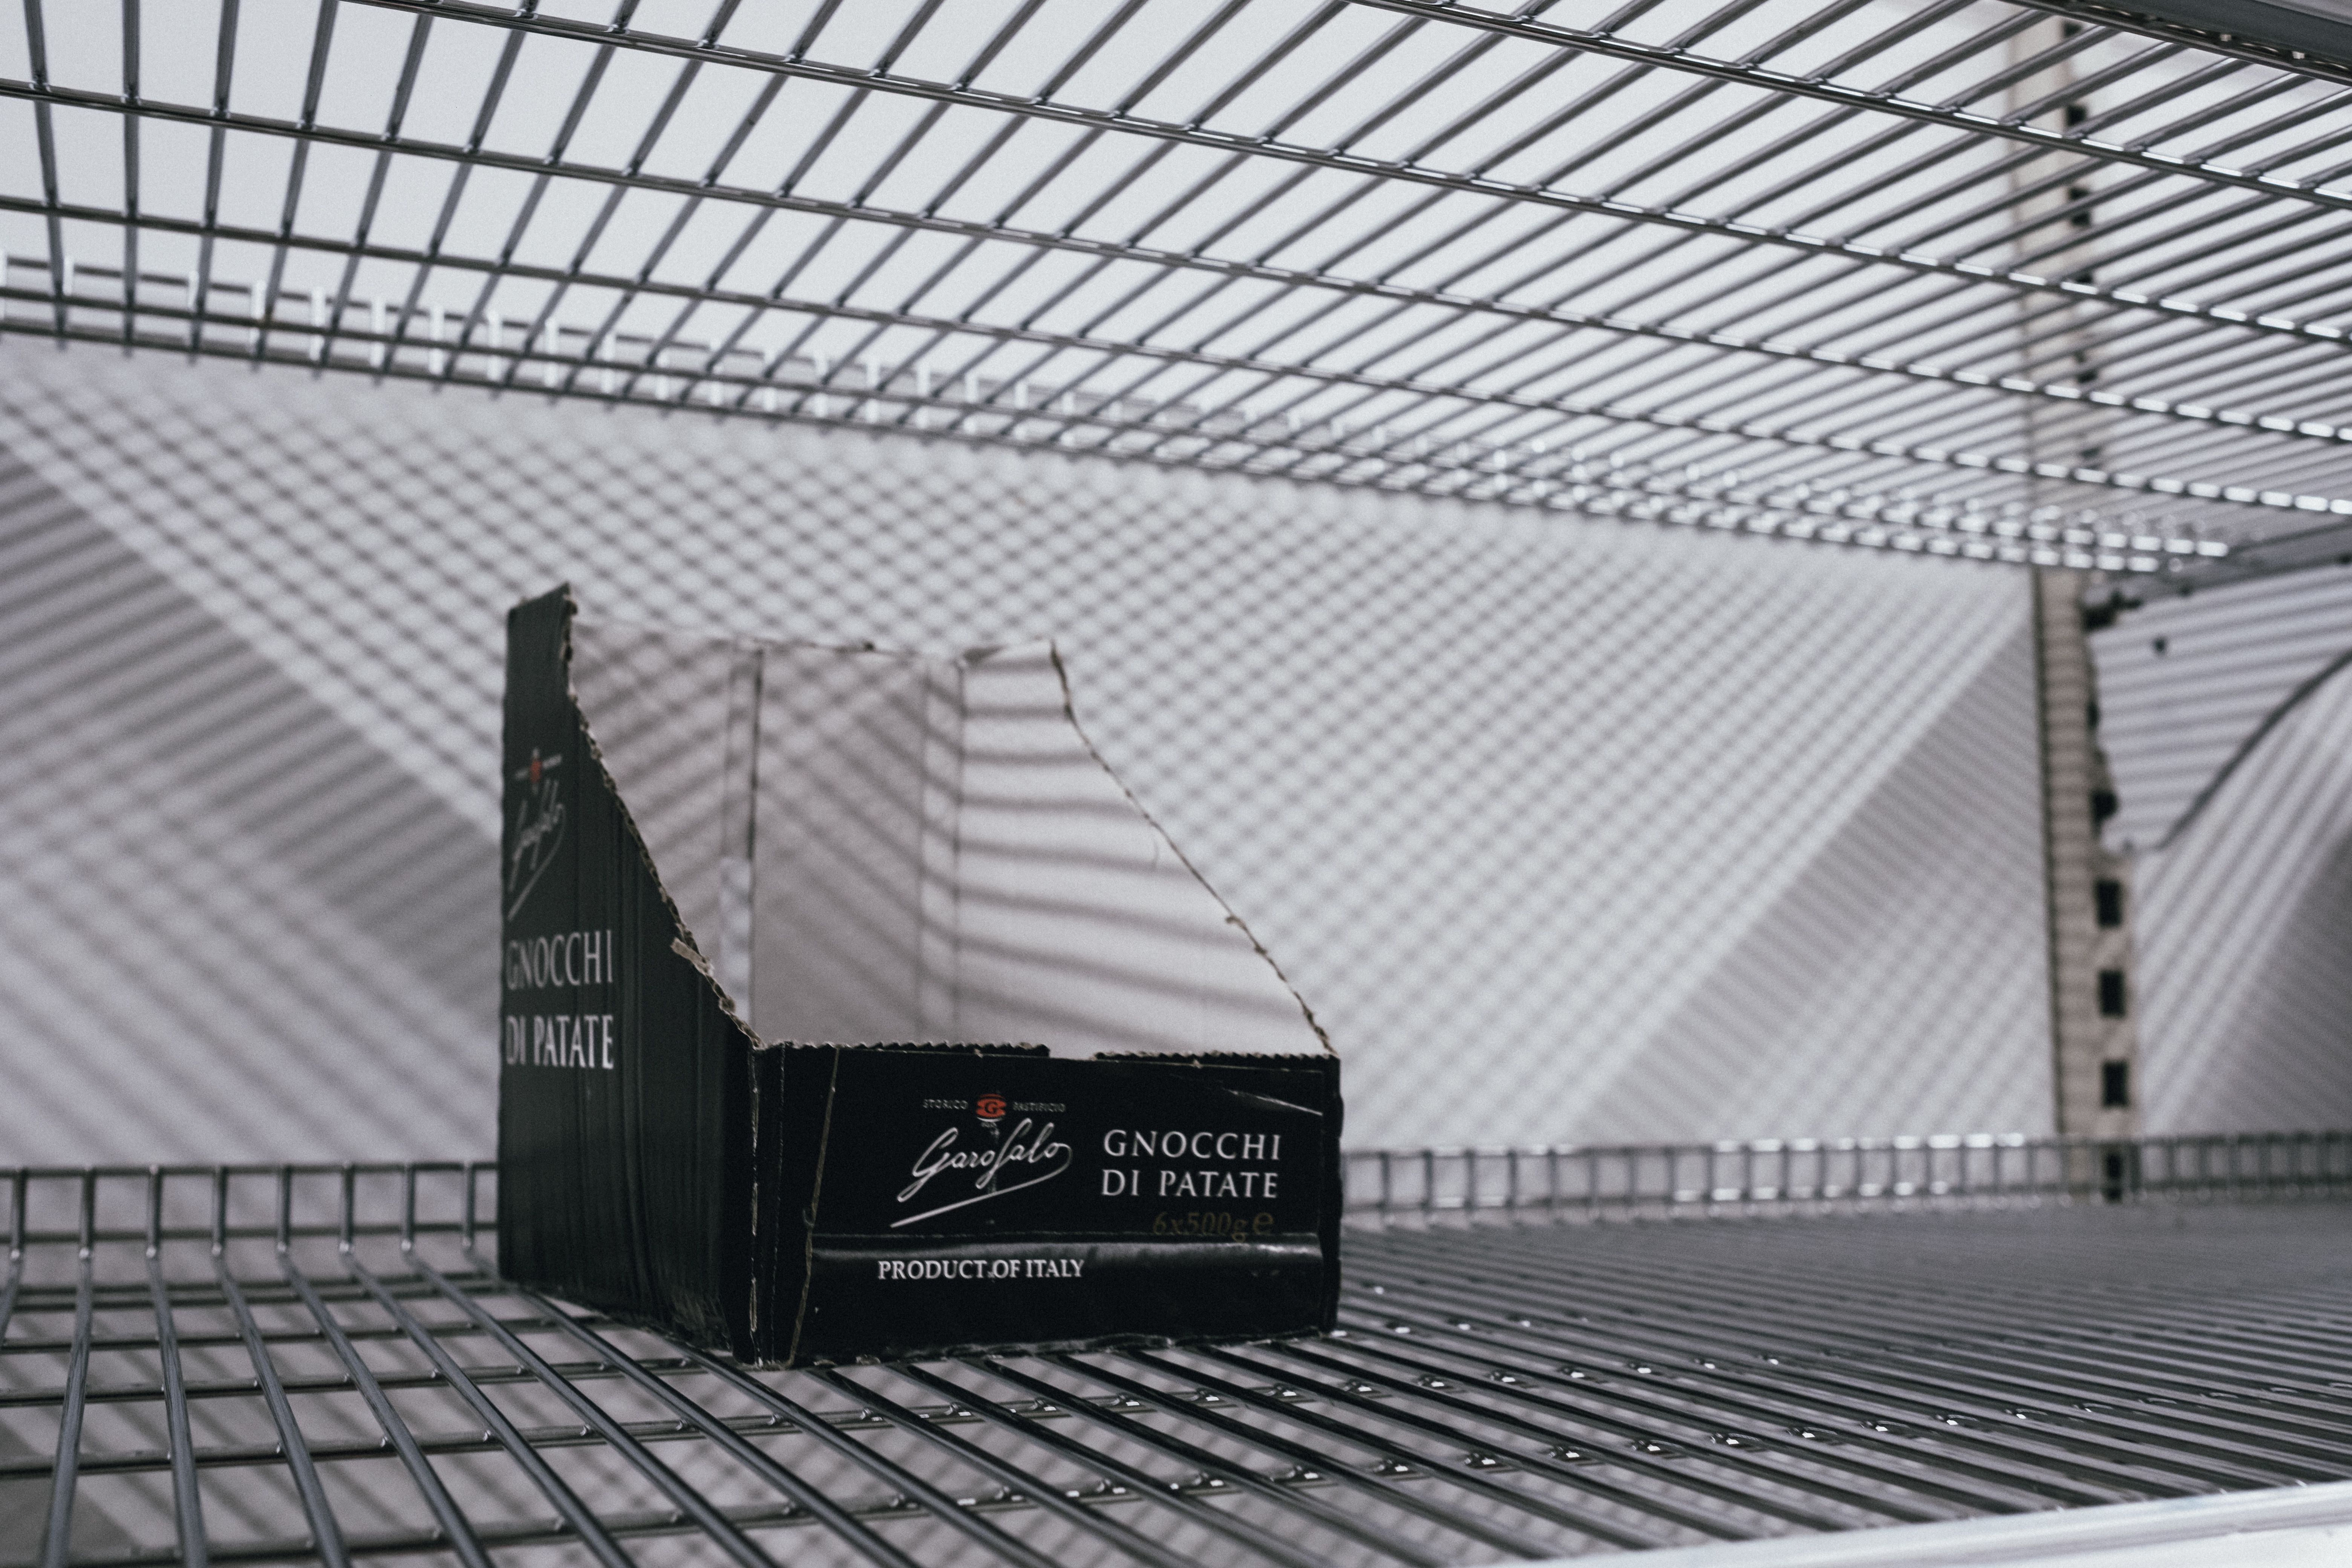
Shrinkage is the difference between the units your system says you own and the units a count says you own. In a single-warehouse business that is one subtraction. In a multichannel business with a 3PL, an owned warehouse, and two marketplace fulfillment networks, it is four separate subtractions that must never be added together before they are examined.
The reason is simple and expensive: a loss at one location and an overage at another cancel out. The net looks acceptable. Underneath it, two different operational failures are running and each is invisible because the other is masking it.
The National Retail Federation's National Retail Security Survey 2023, published September 2023, found the average shrink rate in fiscal 2022 rose to 1.6 percent of sales, up from 1.4 percent in fiscal 2021, representing about 112.1 billion dollars in losses across U.S. retail.
Two caveats matter before you compare your own number to it. The survey population is weighted toward physical retail, where the loss mechanisms include shoplifting and point-of-sale fraud that have no ecommerce equivalent. And the NRF discontinued that annual shrink survey afterward, so there is no more current figure from the same source and no authoritative ecommerce-specific equivalent.
Treat 1.6 percent as evidence that shrink is material enough to have its own accounting treatment, not as a target you should be hitting. Your own trailing figure per location is the only benchmark that means anything.
Six mechanisms, and they have different owners.
Fulfillment center loss. Units received by a marketplace network and never accounted for. Usually recoverable through the platform's own claims process, and usually only if you notice within their filing window.
3PL miscount at receiving. The container said 4,800 and the 3PL logged 4,760. If nobody compared, your system holds 40 units that never existed and it will be blamed on shrink at the next count.
Damage in handling. Real units destroyed. This is not shrinkage in the mysterious sense, it is a loss with a cause, and it belongs in its own account.
Unmatched returns. A customer return that the platform refunded and that never physically arrived, or arrived and was scrapped without a record. The refund hits your revenue and the unit never comes back to stock.
Mis-ships. The wrong SKU picked and sent. Two errors at once: one SKU short, one SKU long, and both look like independent shrink events.
Recording errors. A receipt entered twice, an adjustment posted to the wrong location, a transfer received but never shipped out of origin. These are the largest single category in most files and the easiest to fix, because they are not losses at all.
One SKU family, four locations, count performed 30 September.
| Location | System units | Counted units | Variance | Unit cost | Value variance |
|---|---|---|---|---|---|
| Own warehouse | 8,420 | 8,398 | -22 | 9.60 | -211.20 |
| 3PL East | 12,300 | 11,940 | -360 | 9.60 | -3,456.00 |
| Marketplace FC | 19,850 | 20,110 | +260 | 9.60 | +2,496.00 |
| WFS facility | 4,600 | 4,512 | -88 | 9.60 | -844.80 |
| Total | 45,170 | 44,960 | -210 | | -2,016.00 |
Net shrink of 2,016.00. Against quarterly cost of goods sold of 412,000 on that family, that is 0.49 percent. Reported as one number, it looks like a well-run operation.
Read per location, it is nothing of the sort.
The 3PL lost 360 units, which is 2.93 percent of what they were holding. That is a vendor performance problem with a contract remedy attached to it.
The marketplace fulfillment center shows 260 units more than your system expected, a 1.31 percent overage. An overage is not good news. It almost always means units were received against the wrong SKU, or a prior loss is reversing, or a return was restocked without a record. Every one of those is a data problem that will produce a real loss later.
Two failures of roughly 3 percent and 1.3 percent, each with a different owner, hidden inside a 0.49 percent net. That is the entire argument for computing variance per location before anything is combined.
Multiplying units by a single average cost is the second error in most shrink calculations.
Under FIFO, the units missing are the oldest layers still on the books. If the 3PL's remaining stock spans an older layer at 11.20 and a newer one at 9.60, a 360 unit loss should be valued against the layer FIFO would have consumed. At 11.20 that is 4,032.00, not 3,456.00. A 576.00 difference on one line of one count, and the same logic applies to every line.
The distinction matters most for products whose landed cost has moved. A SKU whose cost fell 15 percent after a freight rate drop will have its losses systematically understated by average costing, because the losses are old units and the average is dragged down by new ones.
Debit an inventory shrinkage and adjustments account. Credit inventory. Keep it out of cost of goods sold.
The reason is not technical, it is managerial. Gross margin should describe what it costs to make and deliver a sale. Loss is a different problem, owned by different people, fixed by different actions. Buried inside cost of goods sold, a 2,016.00 loss is indistinguishable from a supplier price increase and nobody investigates it. On its own line, it has a trend, and a trend is what starts a conversation with a 3PL.
Damage and obsolescence deserve their own account for the same reason. Three accounts below the inventory line, each with an owner:
Marketplace reimbursements for lost units are a recovery credited against the shrinkage account, not revenue. Booking a reimbursement to sales inflates your top line and leaves the loss showing as gross.
Annual counts are too infrequent to attribute anything. By the time you find a 2.9 percent variance in a December count, you have twelve months of possible causes and no way to isolate one.
Cycle counting solves this by counting a rotating subset continuously, so a variance is bounded by the interval since that item was last counted. Inside ConnectBooks, cycle counts are performed through inventory adjustments, and the audit trail records who adjusted what and when, which is the part that makes a variance investigable rather than merely known. The operational side is covered in how to run a cycle count.
A workable rotation for a multichannel seller:
Marketplace-held stock cannot be physically counted by you, so the equivalent is reconciling their inventory report to yours on the same cadence and filing claims inside their windows.
A per-location variance report, run monthly, valued at layer cost, with a trend line per location and a named owner for each. Variances posting to their own accounts rather than into cost of goods sold. Reimbursements netted against the loss they relate to. Counts frequent enough that a variance has a bounded cause.
That structure is what makes the inventory balance on your balance sheet something you can defend rather than something you plug. Stock tracked by warehouse, adjustments with an audit trail, and cost of goods and adjustments posting automatically into your accounting system based on settlement data is the mechanism, and it is what stands behind an accuracy guarantee. The channel-level side, including Walmart, feeds the same ledger.
Running an e-commerce business comes with plenty of challenges, but ConnectBooks is here to make your life easier. With real-time insights, seamless integrations, and detailed tracking of your profitability and inventory, you can stay ahead of the game. Whether you’re selling on Amazon, Shopify, Walmart, TikTok or eBay, ConnectBooks helps you manage your finances with 100% accuracy and confidence, so you can focus on growing your business.
Ready to level up? Start making smarter, data-driven decisions every step of the way. Try ConnectBooks Free Today or Schedule a Demo