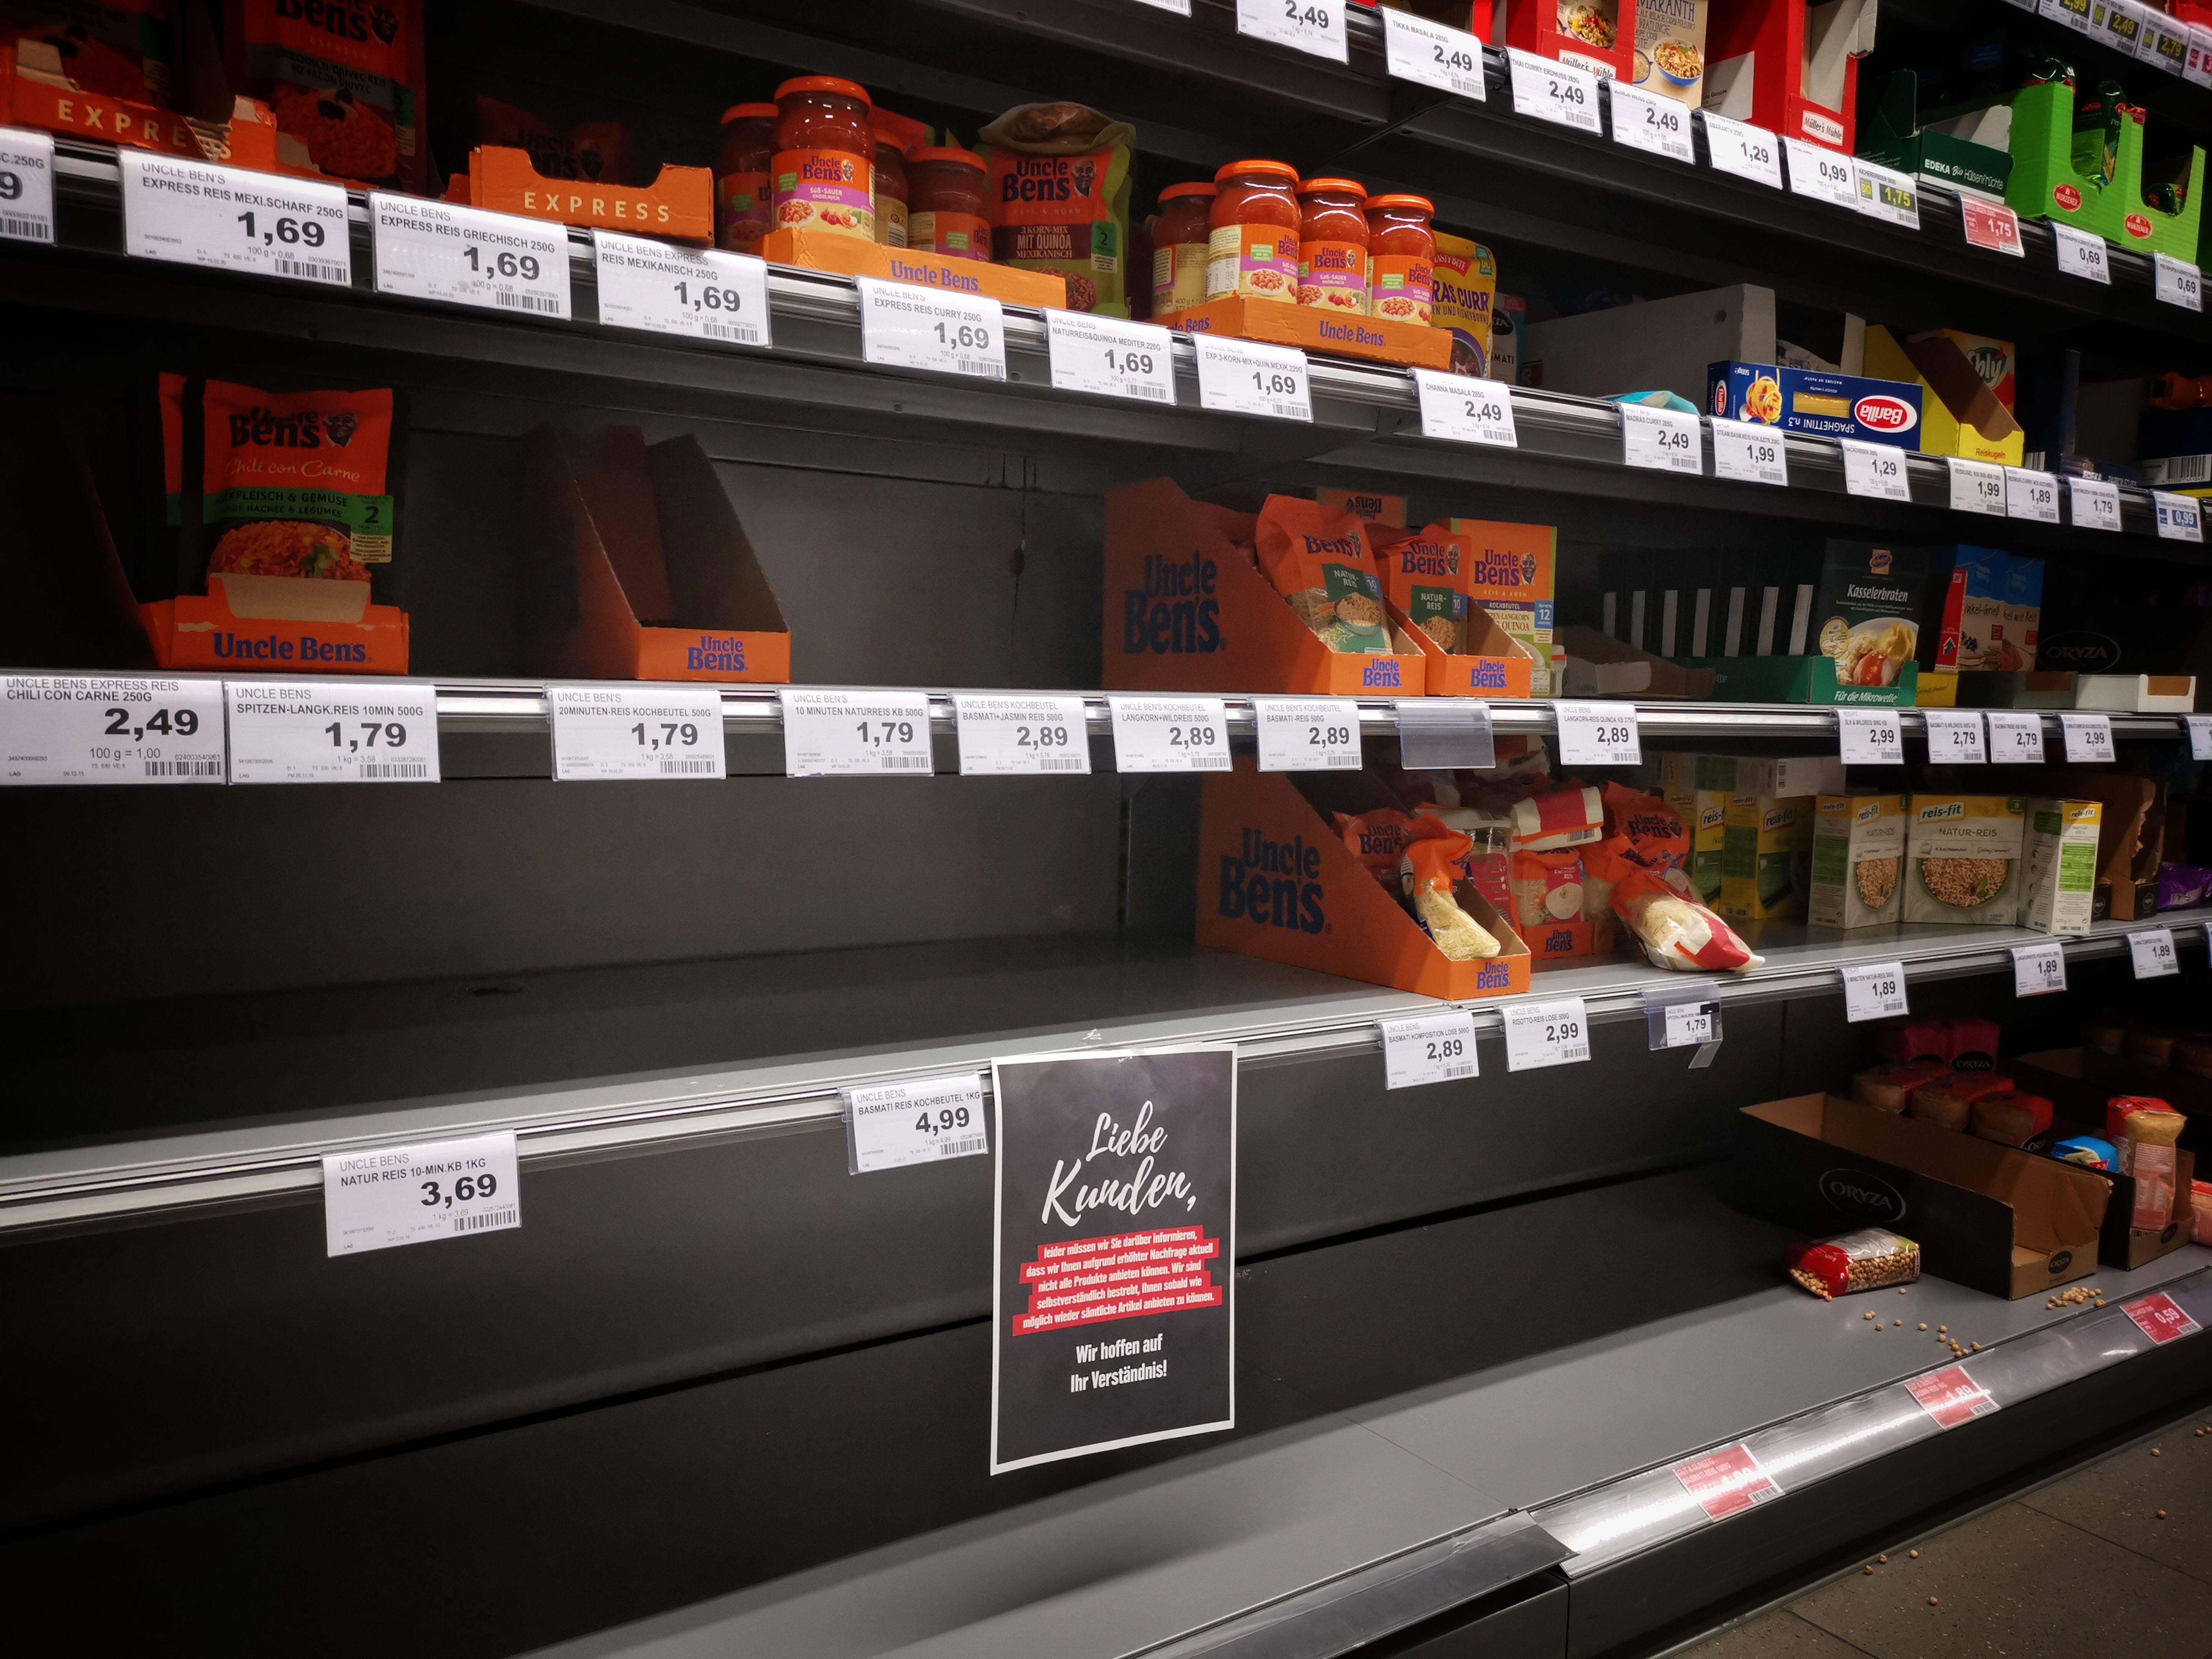
Every stockout conversation starts with the same calculation: units we would have sold times price. It produces a large, alarming figure that is wrong by roughly a factor of five, and because everyone knows it is inflated, the number gets discounted to zero and the real cost never gets measured.
The cost of a stockout is the contribution margin you did not earn on demand that did not defer, plus the velocity and ranking decay that persists after you restock, plus whatever you spend to shorten the outage. That number is much smaller than lost revenue and much larger than nothing, and it is the only version that can be compared against the cost of carrying more stock.
Gruen, Corsten and Bharadwaj published *Retail Out-of-Stocks: A Worldwide Examination of Causes, Rates, and Consumer Responses* through the Grocery Manufacturers of America in 2002. It remains the most widely cited study of consumer response to an empty shelf, and it found a worldwide average out-of-stock rate of 8.3 percent, with roughly 30 percent of shoppers buying the item at a different retailer.
Two things about that study should be said plainly. It is more than two decades old, and it examined physical grocery shelves, where a substitute sits eighteen inches away. Marketplace search behavior is not the same mechanism. Use the study for its structure, which is that consumers split into substitute, defer, buy elsewhere, and abandon, and do not import its percentages into an ecommerce model.
Your own split is measurable. Restock a SKU after an outage and watch whether the first week runs above baseline. The overage is deferred demand returning.
Forgone contribution. Demand that was genuinely lost, times contribution margin per unit. Not price, and not gross margin either, because the variable costs of a marketplace sale are large and real.
Recovery decay. The period after restock when the SKU sells below its prior rate because ranking, review velocity, and advertising relevance all decayed while it was unavailable. On most marketplaces this tail is longer than the outage itself.
Recovery spend. Air freight, expedited transfers, advertising to rebuild rank. Real cash, spent to shorten the first two components.
Second-order effects. Account health metrics, buy box eligibility on the platforms where availability feeds it, and in the worst case a listing suppression. Hard to quantify per event, and worth naming so that a marginal decision does not get made purely on the arithmetic.
SKU S-88, sold across marketplaces at 42.50.
| Line | Per unit |
|---|---|
| Selling price | 42.50 |
| Landed cost | 16.90 |
| Referral fee at 15% | 6.375 |
| Fulfillment fee | 5.40 |
| Returns provision at 3.2% of revenue | 1.36 |
| Advertising per unit sold | 4.10 |
| Contribution per unit | 8.365 |
Contribution is 19.7 percent of price. That is the number the business actually keeps on one more sale, and it is what a stockout costs per unit of lost demand.
The outage. Fourteen days at a baseline rate of 118 units a day is 1,652 units of unmet demand.
The headline calculation: 1,652 times 42.50 is 70,210.00 of "lost revenue." Nobody believes it, and they are right not to.
Step one, deferred demand. Say 22 percent of that demand returns when you restock. That is 363 units recovered and 1,289 genuinely lost.
Step two, forgone contribution. 1,289 units times 8.365 is 10,782.49.
Step three, recovery decay. The SKU returns at about 70 percent of its prior daily rate and recovers to baseline over roughly four weeks. Averaged across a linear recovery, the shortfall is 15 percent of baseline for 28 days: 0.15 times 118 times 28, or 496 units. At 8.365 per unit, 4,149.04.
Total modeled cost: 14,931.53.
Against a headline of 70,210.00. The headline overstates the damage by 4.7 times. The real figure is still nearly fifteen thousand dollars on a single SKU over a single two-week outage, which is a number worth acting on.
Now the decision that model exists to support.
Air freight on 4,000 units at a 2.85 per unit premium over ocean costs 11,400.00. It shortens the outage from 30 days to 14.
The 16 days avoided would have generated 1,888 units of demand. At the same 78 percent genuinely-lost rate, that is 1,473 units, worth 12,321.65 of contribution.
Spend 11,400.00 to protect 12,321.65. Marginally worth doing, before you count the recovery decay that a 30 day outage would have caused, which would be substantially worse than a 14 day one and pushes the decision clearly positive.
Run the same arithmetic on a SKU with a 3.10 contribution per unit instead of 8.365 and the answer flips. Air freight is not a policy. It is a per-SKU calculation, and the input it needs is contribution margin, which most sellers cannot produce per SKU per channel without exporting three reports and reconciling them by hand.
Compare the cost of being short with the cost of being long.
Carrying 1,652 extra units of S-88 for a quarter at 16.90 landed cost, with a 22 percent annual carrying rate covering capital, storage, insurance, and obsolescence risk, costs 1,535.53.
The stockout cost 14,931.53. Holding the same quantity for three months costs 1,535.53. The stockout is roughly 9.7 times more expensive.
That ratio is the argument for asymmetric safety stock. Where contribution margin is high and carrying cost is low, buy deeper than the formula suggests, because the two errors do not cost the same. Where contribution is thin and the product ages badly, the ratio narrows and the formula's answer is closer to right.
The ratio is SKU-specific and it moves. Storage fees at marketplace fulfillment networks step up sharply for aged inventory, which raises the carrying side for anything slow. A product with a fashion or seasonal cycle can go from a 9.7 ratio to a 2.0 ratio in ninety days.
Worth naming, because most stockouts are not forecasting failures.
Lead time variance, not lead time length. A supplier averaging 42 days with a range of 30 to 70 is far harder to plan around than one that reliably takes 55.
In-transit blindness. Units on the water that the reorder calculation cannot see, so the gap looks larger or smaller than it is.
Demand fragmented across channel aliases and bundle configurations, so no single view of a SKU shows real demand. A SKU selling 900 units through a bundle and 2,600 standalone reads as two small products, and both reorder points are set too low.
Receiving delays at the destination, particularly at marketplace fulfillment networks during peak, where a shipment that clears in two days in March takes two weeks in late November.
Three of those four are data problems rather than forecasting problems, which is the useful part. A restock calculation that includes lead times and inbound stock and reads aggregated demand across every channel and configuration removes most of the exposure. That is what the restock report inside ConnectBooks is built on: sales history and velocity, with supplier lead times and inbound stock factored in. Seasonality is not applied automatically, so the seasonal overlay for Q4 remains a manual step.
The whole model depends on one input: contribution margin per unit, per SKU, per channel, net of referral fees, fulfillment fees, returns, and advertising, against a landed cost that includes freight and duty.
Without it, every stockout conversation defaults to lost revenue, every expedite decision is made on instinct, and safety stock gets set uniformly across a catalog where the cost of being wrong varies by an order of magnitude between SKUs.
With it, the three decisions that follow are arithmetic. That is what profit reporting by SKU and channel built on reconciled settlement data is for, sitting on inventory held by warehouse at FIFO landed cost, with channel data arriving through connections like Amazon accounting. The seasonal version of the same problem is in the Q4 inventory readiness checklist.
Running an e-commerce business comes with plenty of challenges, but ConnectBooks is here to make your life easier. With real-time insights, seamless integrations, and detailed tracking of your profitability and inventory, you can stay ahead of the game. Whether you’re selling on Amazon, Shopify, Walmart, TikTok or eBay, ConnectBooks helps you manage your finances with 100% accuracy and confidence, so you can focus on growing your business.
Ready to level up? Start making smarter, data-driven decisions every step of the way. Try ConnectBooks Free Today or Schedule a Demo